Survey also finds users have average of 35 apps, half used at least weekly.

Greg Sterling on December 7, 2016 at 8:18 pm

Mobile apps command about 60 percent of digital media time, according to comScore’s 2016 Mobile App Report. However, that time is concentrated in a relatively small number of top apps that people use regularly.
App discovery and retention have become a high-stakes game for publishers, brands and retailers. Evidence of this is the fact that app install ads will be worth nearly $6 billion this year for Google and Facebook, with some estimates higher than that. Yet getting someone to download an app is increasingly difficult, and there’s no guarantee of retention.
According to AppsFlyer’s Apps Uninstall Report, “more than three out of every 10 installs of mobile apps globally end up being uninstalled.” The company also observed that Android’s uninstall rate is 2x higher than the iPhone’s.
Google also recently released an app report entitled, “How people discover, use, and stay engaged with apps” (download). Based on a survey conducted by IPSOS of roughly 1,000 US smartphone users, it explores a range of questions about app discovery and usage.
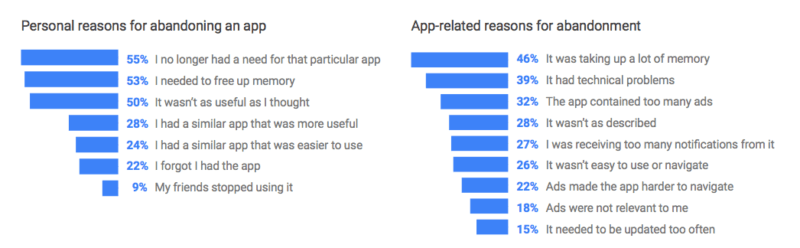
Reasons for App Abandonment
According to the report, users have an average of 35 apps on their smartphones. However, 19 percent had more than 50 apps installed. Usage frequency varied, but just over half of installed apps (52 percent) were used at least weekly, with 31 percent used daily.
The report also identifies a range of personal and app-specific reasons for uninstalls or abandonment (graphic above). App “seasonality,” memory requirements and disappointment over app features or functionality were the top reasons for jettisoning apps. Interestingly, the survey also found that more than 90 percent of users would reconsider an app if the developer addressed the problem issue or deficiency (e.g., memory or data use).
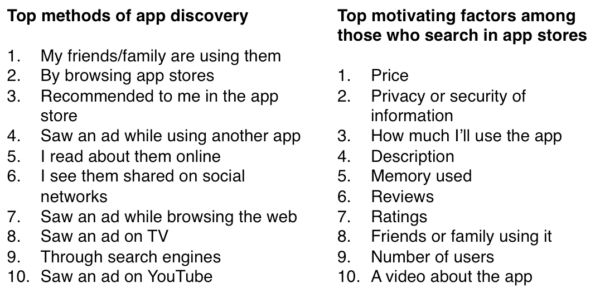
The lists immediately below reflect the top methods of app discovery and the top app consideration factors:
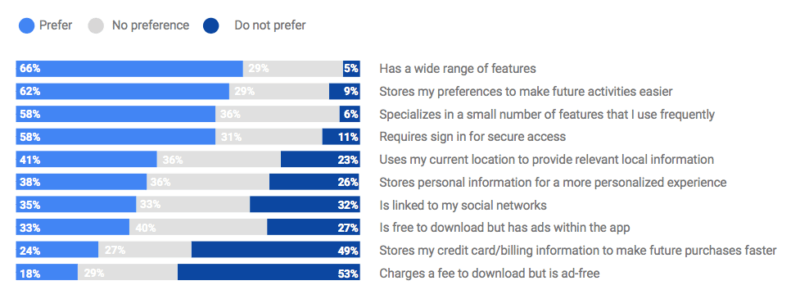
Preferred app features included general utility and potential usage frequency, personalization and app security. Surprisingly, almost half did not prefer credit card storage to expedite purchasing. Responding to a separate question about what makes great apps, respondents cited usability and easy navigation, novelty (new things to explore), personalization and useful notifications.
Preferred features for smartphone apps
The earlier comScore report found increasing user resistance to notifications, with only 27 percent of users saying they “often” or “always” allow notifications. Just under 40 percent said that they “never” or “rarely” allow notifications. The Google findings are somewhat better for marketers: 85 percent of survey respondents said that notifications can be useful.
The “most useful” notifications were found to be those that informed smartphone owners of:
-
1. purchase being shipped/delivered.
2. upcoming reservation or appointment reminder.
3. new discount or offer.
4. upgrade to the app itself (e.g., new feature added).
5. price reduction for a product I’m following.
6. purchase/transaction status update.
7. loyalty points update.
8. new product or service available.
9. reminder of a booking/purchase in progress.
10. recommendation of a product/service.
11. friend or family member purchasing an item.
